Stirling Engines
It is worth noting here that the cycle below is an idealized
model of how how the Stirling Engine functions, in reality the
four steps taken would be less concise.
Cycle Overview:
| 1 |
2 |
3 |
4 |
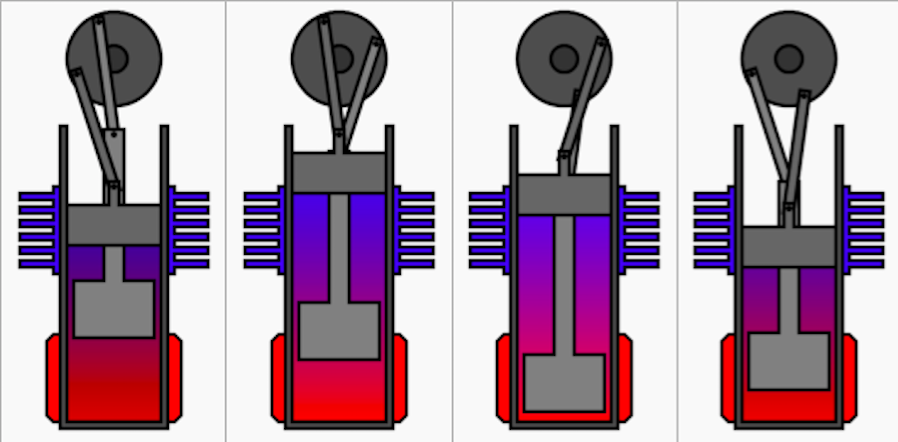
There are four steps that (ideal) Stirling engines take to
complete a cycle, they are shown above.
Steps:
1.
The working fluid is initially
compressed by the power piston, and the displacer is near the
heat sink allowing the air to heat up as it is forced near the
heat source. In this stage the pressure increases as the
volume remains constant.
2.
As a result of the increase in pressure, an
isothermal expansion takes place. The Piston is driven back
expanding the cylinder and decreasing the pressure at a
constant temperature.
3.
The Flywheel drives the displacer
toward the heat source allowing the working fluid to cool
down, all the while the power piston is held in place keeping
the volume constant, which causes the pressure to decrease.
4.
Due to the drop in pressure, the power
piston is pulled in to decrease the volume in the cylinder,
meanwhile the displacer is brought toward the heat sink.
Note: This process repeats itself so long as the heat
source and sink remain at their respective initial
temperatures (more or less). Often though when using metal
fins and the surrounding air as a heat sink (as in the diagram
below), eventually the system will overheat and step three and
four of the cycle will not occur making the system come to a
halt.
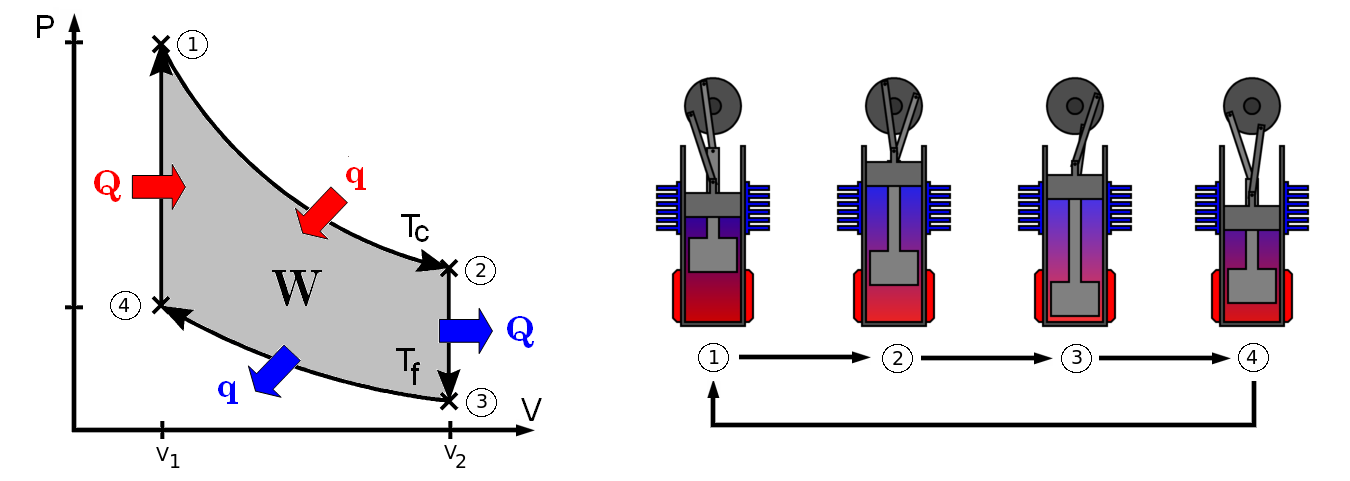
The Pressure vs Volume diagram, above,
relates to the cycle described and gives us a better idea of
what is happening inside the cylinder. This diagram is also
helpful in showing at which stages heat is lost where it is
gained and how much work is done.
The Stirling cycle shown has four sections
two of which (the vertical ones) are isometric processes
wherein changes in pressure and temperature occur. No work is
done during these parts. The other two sections involve an
isothermal change in volume and pressure, these are the
sections where work is done/required; however, the cycle does
produce a net work output.
In reality the P-V plot would not be so
perfect, the diagram shows the ideal system. In reality the
process is not exactly isothermal and the constant volume
parts may not be so as they are controlled by the crankshaft
which is constantly moving. But, due to the fact that each
cycle occurs in a short period of time this idealization is a
good model.
If you would like to learn more about how
this cycle produces work from heat (i.e. the math behind it),
click here.
Professor: David Newman, Ph.D.
Course: PHYS 212
Semester: Spring 2017
Student: Riley Bickford