Vibration Graphs
Below are a few charts that graphically represent various sound waves. The differences in the frequency and amplitude of these waves dictate the pitch and volume that we hear.
Frequency
Frequency is the number of waves that occur within a set time interval. Usually frequency is measured in hertz (vibrations per second).
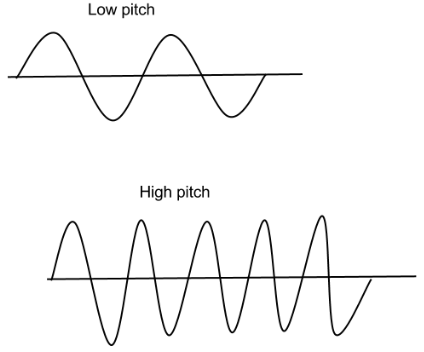
source:http://www.voicescienceworks.org/uploads/5/2/6/0/52608601/2336986_orig.png
Above is an image that has two waves, one with a low pitch and another with a high pitch. The low pitch is created by a low frequency and can be seen graphically by the large spacing between waves (assuming these graphs are using the same scale). On the other hand, the graph of high pitch has waves that are closer together or higher in frequency.
Amplitude
Amplitude is the height of a sound wave measured from the horizontal axis to the maximum point or peak. Amplitude is determined by the size of a vibration which dictates the volume of a sound.

source:http://www.dronstudy.com/wp-content/uploads/2014/01/soft1.jpg
The image above again shows two wave patterns, but this time the difference between the two waves are their amplitude. A wave with a smaller amplitude produces a quieter noise. This is seen by the small distance between the horizontal axis (time) and the peak of the wave. A wave with a larger amplitude produces a louder noise. Likewise, this is because this wave has a larger distance from the horizontal axis to the peak of the wave.
Staccato Sounds
A staccato sound is a sharp distinct note. Graphically this is represented as a high amplitude wave over a very short time period.
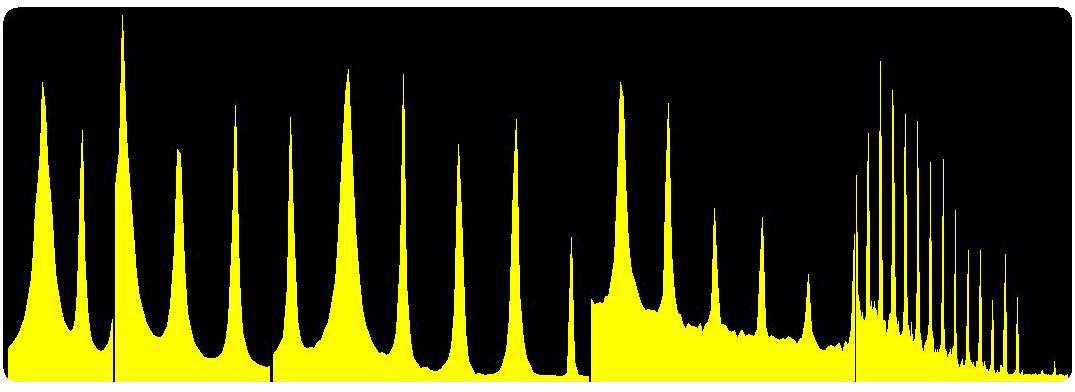
source: http://www.audi-graph.com/images/gunter.png
Each yellow 'spike' in the graph above represents a staccato sound because of its short duration and large amplitude.
Legato Sounds
A legato sound is the exact opposite of a staccato sound; it spans across a long time interval at a (relatively) static amplitude.
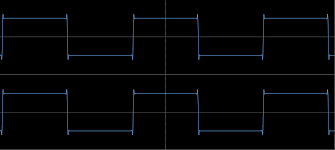
source:https://encrypted-tbn1.gstatic.com/images?q=tbn:ANd9GcRGGaBgJ9VuvqzJwe0XHjjrO-2lkmtdbX_t2ZBns9hboly-04vy
Each upward bar represents a legato noise because of its long duration and static amplitude.
Quick Links
Vibration
Music
source: http://www.one-mind-one-energy
.com/images/tuning_fork.png
Tristan Van Cise
Physics 211
Fall 2016
David Newman
Website Project