
Home Equations and definitions Output Input Conclusions Citations
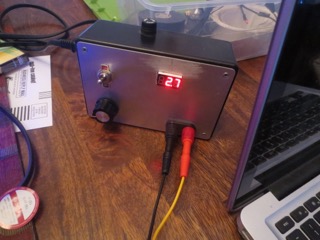
Figure 5: source
Source: The source for the input was this power
source it is a linear 22 volt 2.5 amp max output. For this
experiment the voltage was set to 2.84 volts the display on
the source in the picture dose not display what was used.
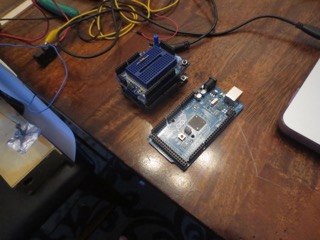

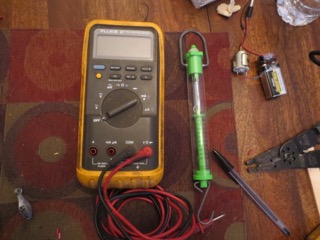
Figure 6,7,8: The data recording
Figure 6,7,8: The data recording
Recording: The voltage was recorded using the small
arduino witch was uploaded to a laptop for analysis,
current was measured with a meter.
Measurements:
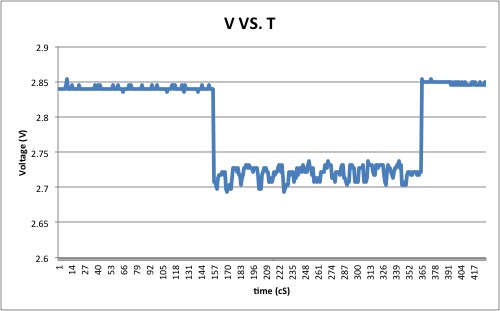
Figure 9: voltage VS. time
Measurements:
Figure 9: voltage VS. time
Looking at the
graph we can see that the motor turns on at 1.67
seconds and off at 3.75 seconds. the vibration when
the motor is on is the weight wiggling as it goes up
from being lifted. the reason why the voltage goes
up after the motor turns off is because of an
inaccurate source.
Note: all componets are in
parallel but the meter
Note: You can not use ohms law
for this calculation because motors are not
resistors
(1.887ohms)(2.84 volts) dose not mean the motor sees 5.36 Amps !!!!
Power:
| Resistance |
Arduino |
motor+meter |
source |
total |
| Ohms |
4840000 |
2.9 |
278.5 |
2.887 |
| sample times for current
(s) |
1.83 |
2.43 |
3.00 |
average |
| current (mA) |
1.44 |
1.45 |
1.48 |
1.46 |
(1.887ohms)(2.84 volts) dose not mean the motor sees 5.36 Amps !!!!
| sample times for voltage
(s) |
1.83 |
2.43 |
3.00 |
average |
| voltage (V) |
2.72 |
2.73 |
2.71 |
2.72 |
Power:
power=I(V)
Power=3.97 mW
Power=3.97 mW