Ekman Flow Visualization and Experimental Observation
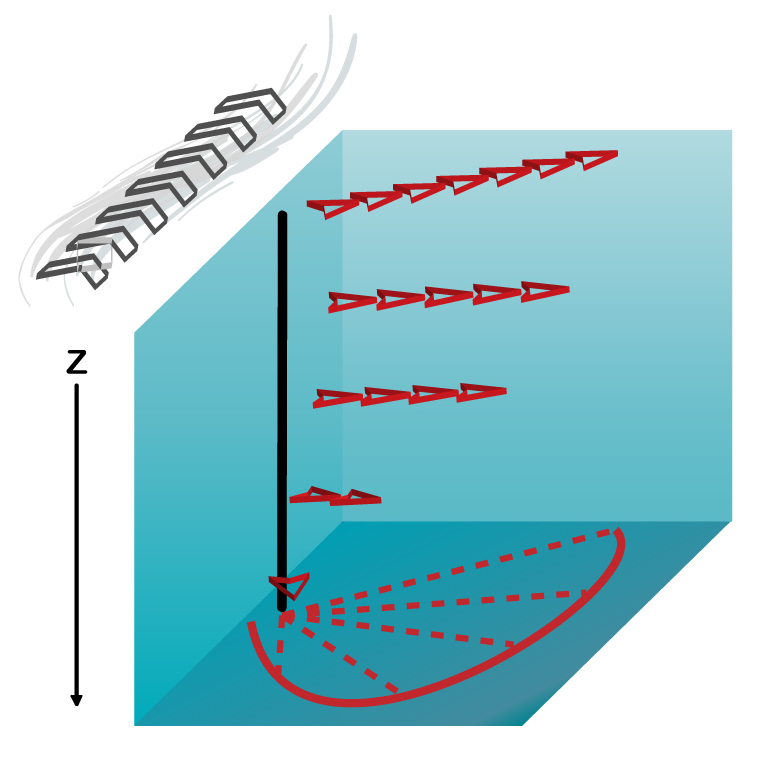
Mock-up Diagram of Flow:
The Ekman spiral flow at a top boundary in the in the
northern hemisphere is known to turn clockwise
(anticlockwise in the southern hemisphere) as depth
increases. At an air-water interface with a constant,
uniform wind blowing across the top of the water, the
no-slip boundary condition demands that the water be dragged
along with the air at the very surface. The Coriolis effect
then turns the fluid flow to the right of the velocity (left
in the southern hemisphere, which is how we get the
anticlockwise spiral). As you look deeper, the viscous drag
force and Coriolis effect turn the fluid flow even further
to its right (or left) until you get to the scale height of
the Ekman layer. A quick diagram depicts a wind-driven Ekman
spiral in an air-water system in the northern hemisphere.

Image credit: http://en.wikipedia.org/wiki/Ekman_layer.
The Black hollow arrows on the top left are the wind
flow along the water surface and the red arrows are the
resulting Ekman flows forming the spiral as depth z
increases. At the bottom is a projection of the
spiraling Ekman flow velocity into the horizontal plane.
The spiral at the bottom of a fluid flow, e.g. at the
bottom of a rotating tank, turns the other way due to
the direction of the viscous drag forcing at the no-slip
boundary being in the opposite direction of the flow.
The same thing happens in the air above the air-water
interface: the Ekman spiral turns counterclockwise as
distance from the interface increases (in the southern
hemisphere, this turns clockwise).
Flow Visualization Experiments:
Using the apparatus built, I conducted several preliminary
experiments aimed at demonstrating the discussed Ekman flow
phenomena. Please note that these experiments may not best
illustrate only Ekman flows as there are many other fluid
flow phenomena occurring in the tank at the same time; I
invite you to come and play experiment for
yourself!
In the following videos, the view is co-rotating with the
tank at an approximate 5 rpm. The water is in solid-body
rotation when the dye is added. The rotation rate is then
slowed to about 3 rpm to set up a rotating flow over the
bottom of the tank. In the boundary region at the bottom, an
Ekman layer forms creating streaks in any dye that is
present. These streaks follow the Ekman spiral structure.
This attempt did not illustrate the Ekman spiral flow
structure very well since not much of the inserted dye did
not fall to the bottom of the tank before the rotation speed
was changed. This resulted in many things happening that
were not the Ekman flow, obstructing our view of the two of
three "streaks" that did form.
The same approach was taken for this video. This time the
tank was filled with warm water and the dye mixed with cool
water and inserted via pipette to encourage dye sinkage.
Improvements still need to be made, namely the dye needs to
be released at the bottom of the tank. The nature of the
no-slip boundary condition tends to discourage flows that
reach the bottom of the tank.
I used a GoPro Hero2 camera (with a WiFi control module
installed) mounted above the tank to record my experiments.
Final Cut Pro was used to white balance the video and add
annotations. Thanks to YouTube for easy video hosting!
Table of Contents:
- Abstract
- Derivation and Mathematical Formulation
- Historical Observations
- Visualization and Experimental Observations (this page)
- Resources