| The Pacific Decadal Oscillation |
|
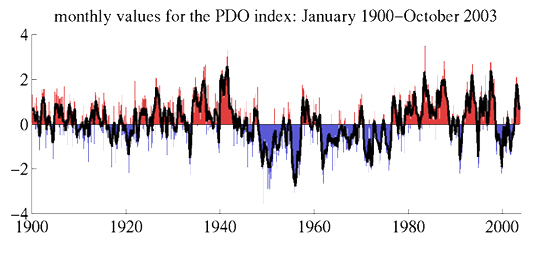
When the PDO Index is positive, waters in the north central Pacific Ocean tend to be cool, and waters along the west coast of North America tend to be warm. The opposite is true when the PDO Index is negative (Null, 2002). The effects of the PDO are most drastic in the Pacific Northwest. In this region, a positive, or warm phase PDO, generally correlates with lower than average rainfall and higher than average air temperatures. Likewise, a negative, or cool phase PDO, correlates with relatively high precipitation rates and low air temperatures (Null, 2002). The following figure shows how the PDO Index has varied over the past century. The PDO appears to oscillate between warm and cool phases every twenty to thirty years. 1900 to 1924, 1947 to 1976, and 1998 to present correspond to the negative, cool phase. The rest of the time period corresponds to the positive, warm phase.
Source: Mantua, 2000 |
|
|