Gases are not good black bodies because they only absorb and emit specific frequencies of radiation, which depends on the gases chemistry. In order for gas molecules to absorb infrared radiation they must have asymmetry in their molecular structure so that they have a dipole moment (uneven charge distribution). Most gases in the atmosphere don't absorb or emit infrared light at all because most of the gases in Earth's atmosphere (oxygen (O2) and nitrogen (N2)) are symmetrical molecules with only two tightly bonded atoms.
The major greenhouse gases, in order of highest concentration, are: water vapor, carbon dioxide, methane, nitrous oxide, ozone, chlorofluorocarbons, and hydrofluorocarbons. All of these gases are composed of three or more atoms that are bonded together loosely enough so that they can (or do) have uneven charge distribution. These gases are chemically structured in such a way that they are able to absorb energy corresponding to distinct wavelengths of radiation in the infrared range.
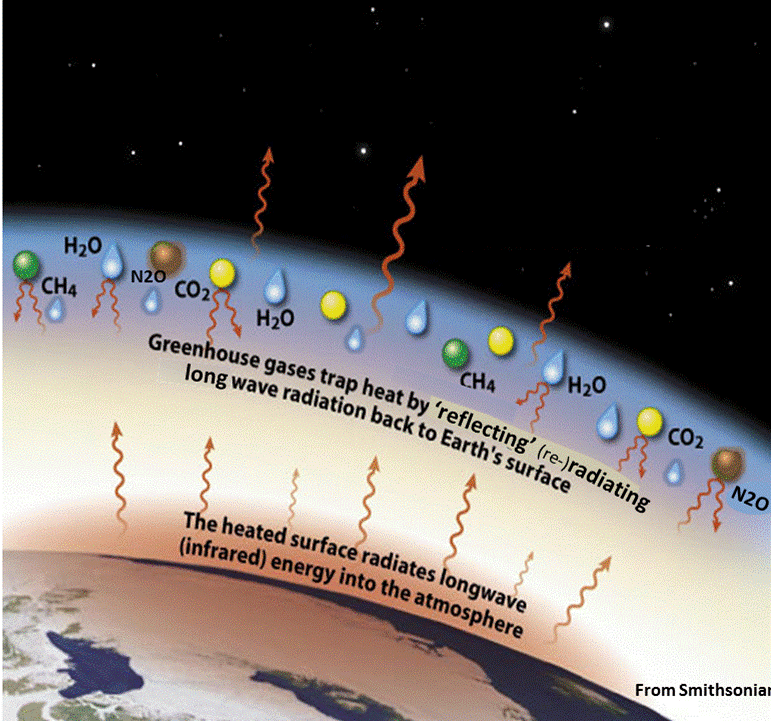
When a gas molecule absorbs radiation (energy) it means its moved from in energy level from ground state to an excited state. In the excited state it will be unstable and will thus eventually emit radiation as it falls back down in energy level to a stabler state. The radiation re-emitted from green-house gases will either be emitted back to Earth's surface, into space, or most likely it will be absorbed by another greenhouse gas molecule. This process keeps energy (heat) near the Earth’s surface (i.e. Greenhouse effect).
 Figure from: https://www.e-education.psu.edu/earth103/node/1006 |
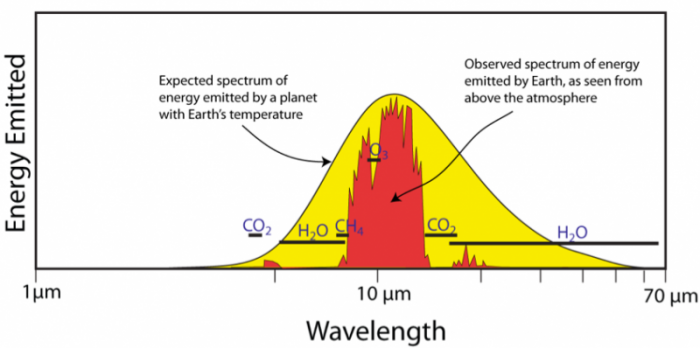
The figure to the left is the absorption spectrum of the radiation emitted from Earth. The smooth curve outlining the yellow region is the theoretical spectrum of energy emitted by a planet with the same temperature as Earth. The observed spectrum is in red and is what indicates that a large portion of the emitted radiation by Earth is absorbed by greenhouse gases. The black lines indicate the absorption wavelength ranges of the main greenhouse gases. This figure is important because it clearly verifies that the greenhouse effect is real and shows how large of an impact greenhouse gases have on Earth's total energy balance. |
 |
< >