Uses of the Reynolds Number
-
Wind Tunnel Models
-
Sources of Drag Revisited
-
Cd vs gap width
The hard working people over at LLNL, NASA and Caltech put a model in a wind tunnel with a thin film of oil on it and this is what they found. See below: (Bib #3)
As you can see from the picture above there are areas where the air flow attaches itself to the body of the model and pushes the oil in flow lines. The areas where the air flow is attached to the body produces minimal drag. It is the areas of recirculation that cause drag because they provide a force against the vehicles direction of travel. Notice the high Reynolds number. This denotes U, the free stream flow, is large.
Here again is the model with a picture of the trailer. Notice the flow recirculation areas at the end of the trailer. This causes the drag that creates a column of air that actually travels with the truck as it goes down the road.
Now we need to reconsider the tractor trailer gap. (Bib. #3)
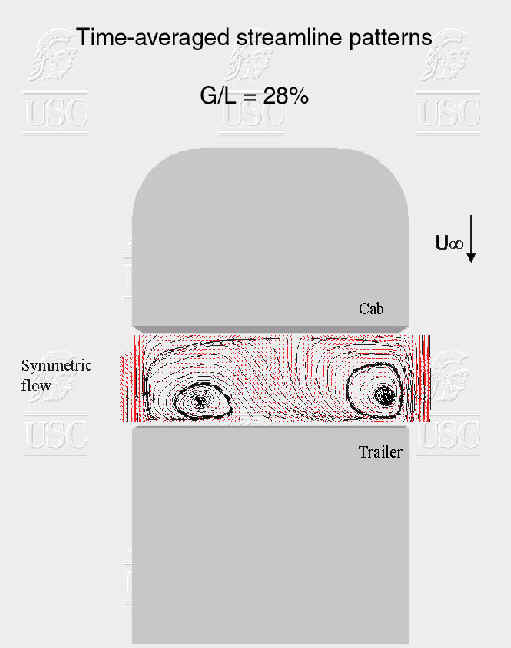
As you can see the free stream flow, U, is passing over the model with zero Yaw Angle. All of the terminology, definitions and models will now gives us a basis of understanding of a graph of Drag Coeff vs Gap width.
Graph of Drag CoEff vs Gap Width
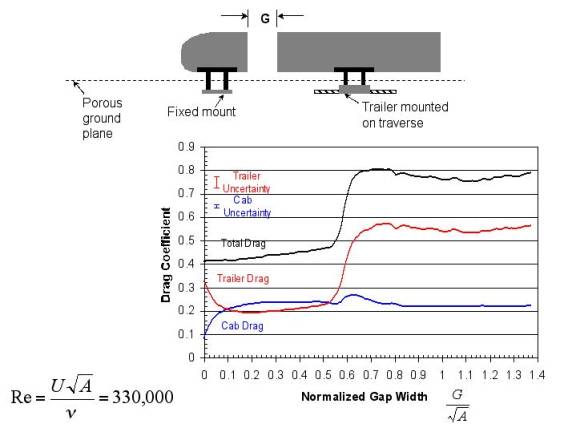
This graph, from Bib. ref #3, shows us that the drag of the tractor trailer combination has an experimental ideal value of about .55 to minimize drag at Re 330,000. The next step in the study of drag is to use computers to model all of the parameters previously discussed.