Okay, it's really there.
The most exciting phrase to hear in science, the one that heralds the most discoveries, is not "Eureka!" but "That's funny..." ~ Isaac Asimov[7]
When we plug in all the stars information and get Radius and Velocity for each star, we are left with 897 data points that really don't make much sense. If we then average the radii and velocities associated with those radii over a range of 500 pc (call these groupings a bin) and plot V versus R, we get a really nice rotation curve plot shown below.

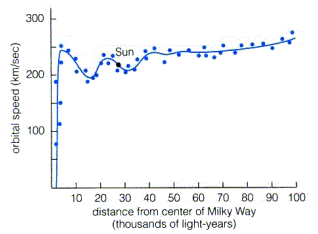
The error bars in this figure are the standard deviations in each bin. The purple line is Clemens's rotation curve. As you can see we arrive at the same general trend as Clemens's curve, which is good -- this means we can use stars to derive a rotation curve which approximates the accepted rotation curve. Now we can actually answer the question we set out to look at. Plugging these bins into our mass equation, and plotting M vs R, we get

We can see from this graph that mass increases the farther out we go. All this is good, the farther out we go, the more stars will me interior to our orbit. Mass should increase. But wait, if we look at the large radii in Clemens's rotation curve

[6]
the curve is essentially flat, meaning that V stays about the same. So then the interior mass increases at a rate proportional to R which means that the mass increases at a constant rate with respect to R (take a derivative with respect to R). This definitely doesn't make sense. As we get farther and farther away from the galactic center, the stars density drops off. So the mass should still be increasing, just at a slower rate the more we increase R. Yet, we just found that the mass increases at a constant rate! There clearly must be more mass than we can see in the galaxy. This missing mass is what we call dark matter -- mass we cannot see, but know must be there.
Next: Dark matter