|
|
Wind Power |
||||||||||||||||||||||||||||||||||||||||
|
The Intergovernmental Panel on Climate Change (IPCC) was established in 1988 by the World Meteorological Organization (WMO) and the United Nations Environment Programme (UNEP). These organizations recognized the potential problem of global climate change and established a panel to explore this problem from scientific research with a goal of distributing this information to the public. "The role of the IPCC is to assess on a comprehensive, objective, open and transparent basis the scientific, technical and socioeconomic information relevant to understanding the scientific basis of risk of human-induced climate change, its potential impacts and options for adaptation and mitigation. The IPCC does not carry out research nor does it monitor climate related data or other relevant parameters. It bases its assessment mainly on peer reviewed and published scientific/technical literature. " Quote from IPCC homepage : http://www.ipcc.ch/about/about.htm The IPCC has made public the contribution from Working Group I towards the Fourth Assessment Report of the IPCC: Climate Change 2007: The Physical Science Basis http://ipcc-wg1.ucar.edu/wg1/docs/WG1AR4_SPM_Approved_05Feb.pdf I have taken several (many) quotes from this document in attempt to show a few key highlights. I have purposely taken this as a lot of direct quotes in an attempt to not muck it up with paraphrasing. I highly encourage whoever is reading this to read the document in its entirety. It is well worth your while. "Global atmospheric concentrations of carbon dioxide, methane and nitrous oxide have increase markedly as a result of human activities since 1750 and now far exceed pre-industrial values determined from ice cores spanning many thousands of years. The global increases in carbon dioxide concentrations are due primarily to fossil fuel use and land-use change, while those of methane and nitrous oxide are primarily due to agriculture." Climate Change 2007: The Physical Science Basis pg. 2
Chart taken from IPCC report Climate Change 2007: The Physical Science Basis pg. 3 http://ipcc-wg1.ucar.edu/wg1/docs/WG1AR4_SPM_Approved_05Feb.pdf "Carbon dioxide is the most important anthropogenic greenhouse gas. The global atmospheric concentration of carbon dioxide has increased from a pre-industrial value of about 280 ppm to 379 ppm in 2005. The atmospheric concentration of carbon dioxide in 2005 exceeds by far the natural range over the last 650,000 years (180 to 300 ppm) as determined from ice cores. The annual carbon dioxide concentration growth-rate was larger during the last 10 years (1995-2005 average: 1.9 ppm per year), than it has been since the beginning of continuous direct atmospheric measurements (1960-2005 average:1.4 ppm per year) although there is year-to-year variability in growth rates." Climate Change 2007: The Physical Science Basis pg. 2 "The primary source of the increased atmospheric concentration of carbon dioxide since the pre-industrial period results from fossil fuel use, with land use change providing another significant but smaller contribution. Annual fossil carbon dioxide emissions increased from an average of 6.4 [6.0 to 6.8] GtC (23.5 [22.0 to 25.0] GtCO2) per year in the 1990s, to 7.2 [6.9 to 7.5] GtC (26.4 [25.3 to 27.5] GtCO2) per year in 2000-2005 (2004 and 2005 data are interim estimates). Carbon dioxide emissions associated with land-use change are estimated to be 1.6[0.5 to 2.7] GtC (5.9 [1.8 to 9.9] GtCO2) per year over the 1990s, although these estimate have a large uncertainty." Climate Change 2007: The Physical Science Basis pg. 2
Chart taken from IPCC report Climate Change 2007: The Physical Science Basis pg. 6 http://ipcc-wg1.ucar.edu/wg1/docs/WG1AR4_SPM_Approved_05Feb.pdf "The understanding of anthropogenic warming and cooling influences
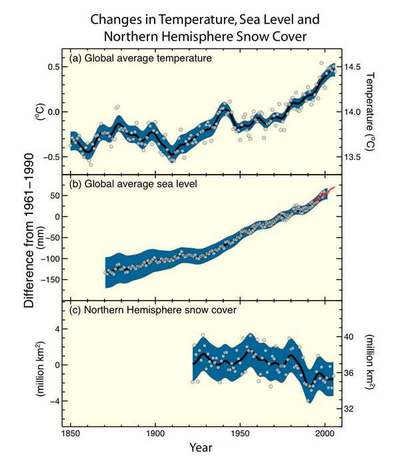
on climate has improved since "Warming of the climate system is unequivocal, as is now evident
from observations of increases in "Eleven of the last twelve years (1995 -2006) rank among the 12
warmest years in the instrumental record of
Table notes: Table taken from IPCC report Climate Change 2007: The Physical Science Basis pg. 9 As you can see from the above, it is very important to find a clean, renewable source of energy. Wind power is becoming instrumental in helping us with the problem of climate change.
|
Kevin Taylor - Spring 2007
Contact: fskdt3@uaf.edu
Physics 212 Web Project
Dr. D. Newman
University of Alaska Faribanks

.jpg)
