Oil Usage
2 May 2010
Courtesy of Gapminder. This chart visualizes data from a handful of countries from 1965 through 2007. It is on a logarithmic scale. View the original graph with variables here. The graph illistrates the relationship between per-person income and oil usage.
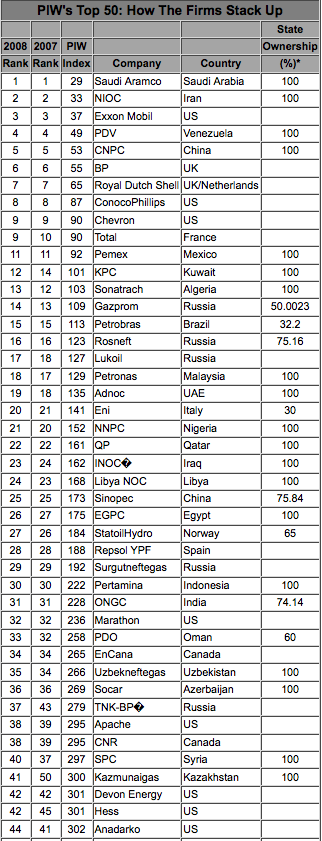
Petroleum Intelligence Weekly’s ranking of the worlds top 40 oil companies. Full Article here, Petroleum Weekly
Worldwide state sponsored companies contraol nearly 60% of all current production and nealry 90% of all future reserves.