image from http://www.powerstream.com
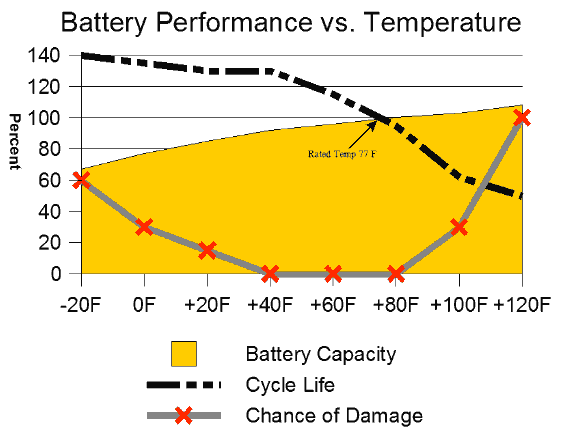
As you can see from the figure above, the lower the temperature, the shorter the life, the higher the temperature, the higher the life. This graph does not however show the temperatures where leakage begins to occur.

image from http://www.solarray.com
This graph is actually for a lead acid battery, but it shows that capacity is modified based on temperature, and that damage to the batter is more likely to occur at low and high temperatures.
Previous Home Next