| Home |
What is GPR? |
Useful Definitions |
GPR Applications |
Table of Material Properties |
References |
How it Works
(Putting it all Together)
The GPR Transmitter creates an electromagnetic field that is directed down into the earth. As the signal travels through the ground, it creates a
cone-like shape. Figure 1 below shows the GPR signal passing through two layers of ground.
Image Source: https://em.geosci.xyz/content/geophysical_surveys/gpr/physics.html#properties-of-radiowave-signals
Figure 1: two layer boundary
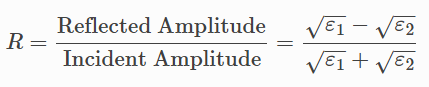
Figure 2 is a radargram showing two distinct layers with different dielectric constants, ice being around a 3 and water being around 80.
A high contrast in dielectric constants will yield better reflection. This is because the velocity travel time between the two
mediums will be very distinct. The closer the two velocities are to each other, the less reflective the return signal will be. The greater
the value of R, the better the contrast.
The higher the dielectric constant, the higher the attenuation. The lower the dielectric constant, the lower the attenuation.
This means that in a low dielectric constant, like ice, the returned signal will be of a higher quality than a high dielectric constant, like water,
which will return a weak signal.
Pictures (a) and (c), used 1500 MHz antennas, while pictures (b) and (d) used 100 MHz antennas. Notice how
using a higher frequency antenna will give a more detailed radargram of the surface near the antenna, but fails to
render greater depths in detail. Using the 100 MHz antenna gave a radargram reading that was less detailed,
but was able to penetrate deeper and show the riverbed. This is because lower frequencies have less
attenuation than higher frequencies.
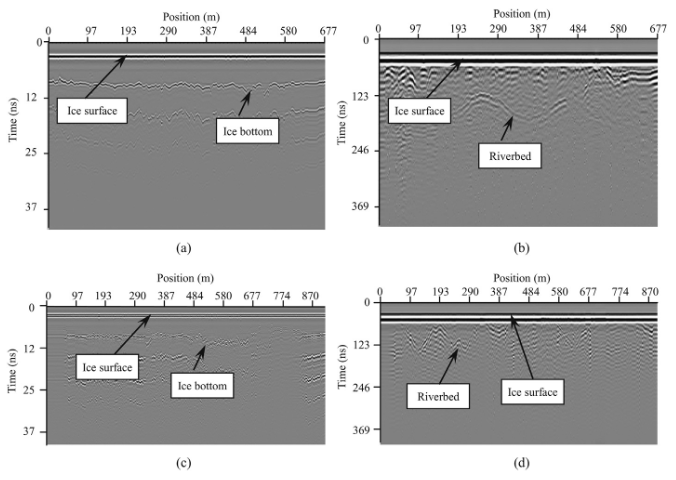
Image Source: Fu, 89
Figure 2: Ice/River radargram
When the transmitted signal hits an object, the frequency waves will bounce back to the receiver and create a parabola shape.
Figure 3 demonstrates wave behavior when an object is encountered.
Image Source: https://em.geosci.xyz/content/geophysical_surveys/gpr/physics.html#properties-of-radiowave-signals
Figure 3: radar hitting a subsurface object
Figure 4 shows what multiple buried objects will look like on a radargram. Notice the hyperbolas.
The location of each buried object should be located within the parabola at the highest point.
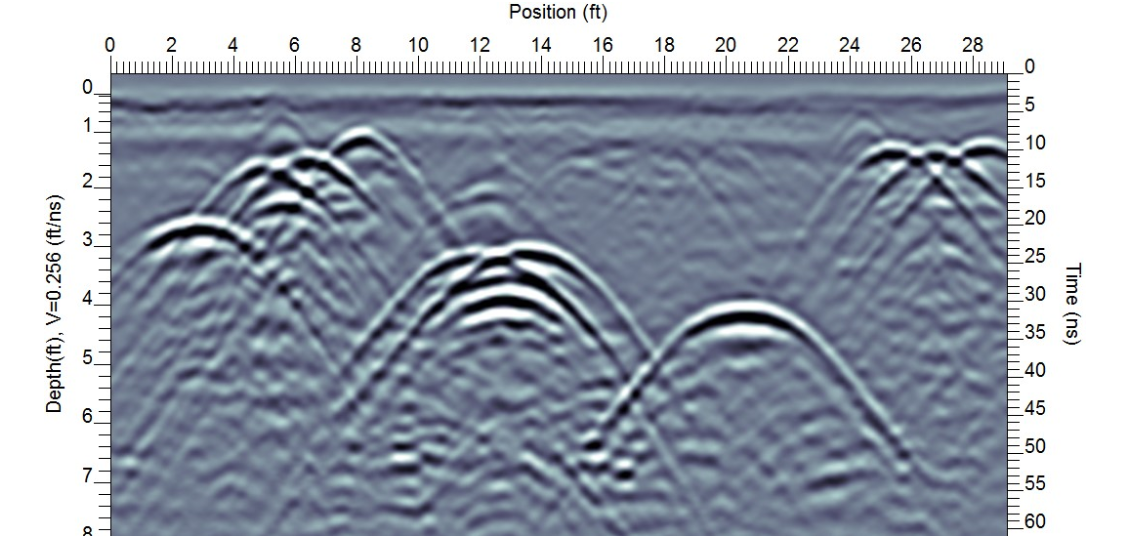
Image Source: https://www.sensoft.ca/blog/underground-utility-locating-gpr-data/
Figure 4: Radargram of multiple subsurface objects
An important factor to consider when reading imagery, is that the reflected image is not an actual map. GPR imagery
is time-dependent, meaning that the processing unit determines an estimated depth reading based on transmitted
and reflected velocities. It is always important to ground-truth the GPR unit before starting with an object
buried to a known depth.
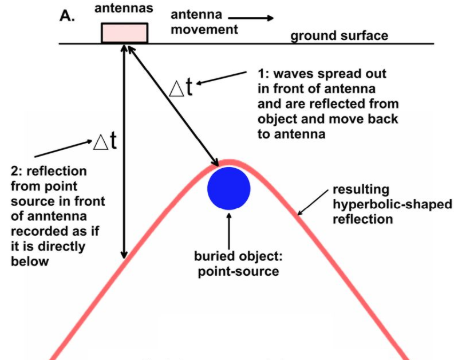
Image Source: Conyers, 1018
Figure 5: hyperbola formation of a buried object
Figure 6 shows what scattering will look like. Due to the non-homogeneous environment, many of the
reflected waves return as background noise.
Image Source: https://em.geosci.xyz/content/geophysical_surveys/gpr/physics.html#properties-of-radiowave-signals
Figure 6: Example of scattered waves