Results
and comparison (pseudo-section vs. geological section)
The next pseudo-section was obtained after
using the right image enhancement and processing parameters for the GPR data.

Figure 5.1 GPR Washington Creek
pseudo-section
The
pseudo-section data give us the velocity and the frequency data transmitted by
the antenna to the ground in a certain period of time. This data was used to
calculate the resultant subsurface depth from the GPR test. For the total 55 m
length of our site the total depth using GPR was about 5 m. Table 5.1 gives the
exact depth and velocity values with respect to time. Appendix A shows the
different reflected waves in ns per location in our study area. From the
analysis of these wavelength values it was possible to obtain the thickness of
each layer.
|
Location |
time ns |
time (sec) |
velocity m/s |
depth |
|
4 |
2.99 |
2.99E-09 |
169941166 |
0.254062044 |
|
5 |
7.85 |
7.85E-09 |
169941166 |
0.667019078 |
|
6 |
7.85 |
7.85E-09 |
169941166 |
0.667019078 |
|
7 |
10.68 |
1.068E-08 |
169941166 |
0.907485828 |
|
3 |
10.92 |
1.092E-08 |
169941166 |
0.927878768 |
|
9 |
12.94 |
1.294E-08 |
169941166 |
1.099519346 |
|
10 |
13.27 |
1.327E-08 |
169941166 |
1.127559638 |
|
2 |
13.43 |
1.343E-08 |
169941166 |
1.141154932 |
|
12 |
14.89 |
1.489E-08 |
169941166 |
1.265211983 |
|
1 |
16.26 |
1.626E-08 |
169941166 |
1.381621682 |
|
11 |
34.71 |
3.471E-08 |
169941166 |
2.949328941 |
|
8 |
49.68 |
4.968E-08 |
169941166 |
4.221338571 |
Table 5.1 Total depth of the layers
Shallow penetration of 5 m indicates the
presence of water in the soil. The water absorbs the most of the energy from
the transmitter and that is why it did not penetrate deeper.
The
result obtained from the GPR survey agreed with the results obtained in the two
previous seismic and resistivity test. According to our resistivity test and it
corresponding values there are also 3 layers of unfrozen silty-clay
(~0-1m) , frozen soil(~1-3 m) and permafrost(~3-5) in
the area. The next pseudo-section obtained from our resistivity survey
illustrates the 3 subsurface layers.
Prior
seismic and resistivity surveys performed by the team indicated that the
results of the GPR match the data obtained before.
Resistivity
survey results
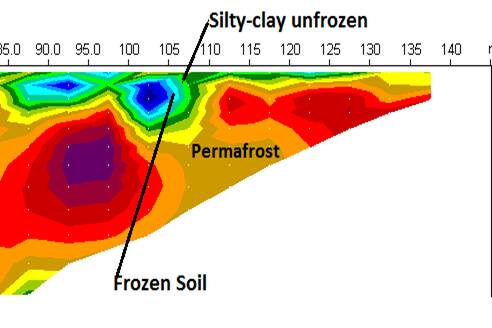
Figure
5.2 Dipole-dipole resistivity survey of the Washington Creek site
Next
are the results from the resistivity survey obtained by the team in previous
studies.
Depth
(m) Distance (m) Color Resistivity (Ω.m) Soil/rock
0-0.5
85-95 Blue ~ 100-1299 silty-clay
0.5
-5.0 85-95 Green ~ 1776- 2428 frozen soil
0-8.50
100-110 Green ~ 100-2428 silty-clay with ice
0-0.5
110-130 Blue/green 100- 1299 permafrost
0-5.0
130-135 Yellow 3319 permafrost
8.50-26
85-110 Brown-Purple ~3319-6202 Permafrost
The values obtained from the resistivity data
are easier to interpret. The signals penetrate deeper allowing us to see the
subsurface layers deeper. Comparing this data with our GPR data the permafrost
layer is about 5 m deep for the resistivity and about 2 meters deep for the GPR
data. Even though the GPR did not penetrate deep into the subsurface the data
is more accurate since this value is close t the value obtained by DOT in some
of their studies of the area.
Seismic
survey results
The
seismic survey also gave us a close
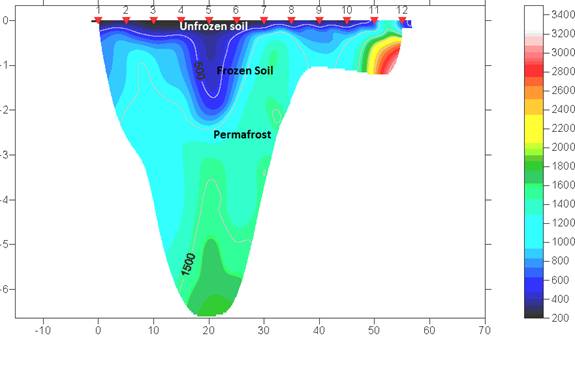
Figure 5.3 Seismic Survey pseudo-sections
According
to the seismic survey pseudo- section, for a depth of 6 meters there are 3
subsurface layers in our study area. This also agrees with our results obtained
from the other two field test performed by the team. So far our interpretations
of the subsurface condition of the soil have been well interpreted.
Values
for the seismic survey are:
0-0.5
m = Organic layer
0.5-2
m = Active layer
2-6
m = Permafrost