Probability in Physics
Trace Braxling
Physics 212 F09
What is Probability?
When someone flips a fair coin, it is said that it has a
50% change of landing heads, and a 50% chance of landing tails.
But what does this mean? The way that a coin lands can be
calculated. A machine can be built that flips a particular coin in
a particular way so that it lands on an exact face every single
time. So why do we determine possible outcomes by percentage
probability? It may be relatively easy to calculate the outcome of
one coin flip, but what about 100 coin flips? 1000? 1,000,000? At
a certain point, calculating the outcome of an event becomes so
difficult that it is easier to describe it it terms of
probability.
If 1,000,000 fair coins were flipped, probability states
that 500,000 will land heads, and 500,000 will land tails.
Although it is likely that this would not exactly happen, the true
number of heads and tails will be close to this number. Thus, in
events where the exact outcome is not easily determined, we use
probability to approximate the outcome. So in reality, probability
is a way for us to comprehend the outcome of something normally
too complex for us to easily calculate.
Sample Size and Confidence Interval
It should be noted that the probability of a given event is not
inherently known. It has to be calculated. Imagine that we do not
know the probability that a fair coin will land heads, and are
trying to calculate it. If the coin is flipped three times and
lands heads twice, the only information that can be obtained is
that heads has a 66% chance of appearing. To obtain an
accurate probability of any given event, a large sample size is
needed. If 100 coins are flipped, a possible result may be 55
heads. 55% is much closer to the "true" value than 66% is. In
probability, there is something called the normal distribution,
that describes the probability that any value lies within a
certain number of standard deviations from the mean. The normal
distribution is illustrated below.

A table illustrating the normal distribution prepared by the NY
State Education Department found at
http://www.regentsprep.org/regents/math/algtrig/ats2/normallesson.htm
For example, there is a 68% chance that any given value lies within
one standard deviation from the mean. However, this assumes an
infinite sample size. In reality, no sample size is infinite. When
dealing with a limited sample size, something called a confidence
interval can be used to describe the confidence that the true mean
lies within a certain value.
The equation for a confidence interval is a follows:

Confidence interval as described by Philip Mayfield retrieved
from http://www.sigmazone.com/binomial_confidence_interval.htm
Where
p is the sample probability
n is the sample size
z1- α/2 is the confidence that you want,
based on the normal distribution.
For example, in the example above where 56 heads were flipped, if
you wanted to be 90% sure that the true value lies in a certain
interval, you would calculate
0.55 ± 1.645 √(0.55(1-0.55)/(100))
= 0.55 ± 0.082
Having a higher confidence results in a wider range
For 95%,
0.55 ± 1.96 √(0.55(1-0.55)/(100))
= 0.55 ± 0.098
For 99%,
0.55 ± 2.57 √(0.55(1-0.55)/(100))
= 0.55 ± 0.128
Perhaps one of the most important things to take away from this
equation is that increasing the sample size decreases the error.
If the sample size is increased from 100 to 1000, then the sample
mean would likely be closer to the true value, and the error is
decreased
An
If 512 coins out of 1000 land heads, and a 99%
confidence interval is wanted, then
0.512 ± 2.57 √(0.55(1-0.55)/(1000))
= 0.512 ± 0.041
A much more accurate interval than the one calculated
from the value calculated with only 100 trials.
An interesting consequence of the confidence interval is that
given an interval, one can calculate the sample size they need to
achieve that interval by rearranging the equation.
For a 99% confidence interval, if a interval of no more than 0.01
is wanted, than a sample size of 16500 is needed.
Is True Random Real?
So is there such a thing as true random? In
short, no. Rolling a set of dice may seem random, but is in
fact governed by physics. As you throw the dice, you put a
torque and velocity on it. Afterwards, gravity takes over,
causing the dice to fall a certain distance. As they hit they
ground, they may roll or bonce, depending on the properties of
the surface they are hitting. If the proper parameters were
input to a computer, it could precisely calculate what the
dice would land on every single time. Such a calculation for
any single source of "randomness" could be developed.
In many cases, it is desirable to generate random numbers,
however, computers cannot easily create random numbers.
Many computer applications use something called a pseudorandom
number generator that takes an initial number called a seed,
and preforms a complex algorithm on it to generate pseudo
random numbers
below is a small example of what computers can do with random
numbers. I made a program in which a number of boxes will
appear. The boxes can randomly be brown, red, or grey, with
red being the most common and grey the most rare. You can use
the mouse to drag them around. If you drag them off of the
screen, they will fall, and a new box will take its place in a
random position on top of the screen.
However, no computer generated number is truly random, as is
can always be traced back to its seed number from the
algorithm.
The website random.org has a fairly unique solution to this
problem. They generate random numbers based on background
radio noise.
Some Examples
We can find many examples in nature where
it is easiest to use probability to model what is happening.
Any given event will most not likely not occur in the same way
twice. For example, imagine if you were to take a cannon,
launch it, and see where it lands. Consecutive cannons
launched at the same velocity are likely to land in different
spots. How the cannons land may look something like this.

This image made by me illustrates possible landing spots of
the cannon
Due to minor variations in the wind, shape of the projectile,
and velocity, the cannon will most likely land in different
spots.
Other examples of probability include radioactive decay and
quantum theory.
Finding Life
"Space is big. You just won't believe how vastly, hugely,
mind-bogglingly big it is. I mean, you may think it's a long
was down the road to the chemist's, but that's just peanuts to
space"
-Douglas Adams, The Hitchhiker's Guide to the Galaxy
The are lots of planets. As many as 100 billion [2] in our galaxy
alone. Planets differ in many ways, from size to temperature, to
the length of their days, to their composition, to many other
things. Life needs a very specific type of planet to flourish. It
can't be too hot, or too cold. The probability of these "perfect"
condidions occuring is fairly low, but due to the sheer number of
planets in existance, these planets may be fairly common.
Astronomers have already discovered at least 29 planets within our
own galaxy that may fit these criteria. Below is an artists
representation of the planets ranked by distance from earth.
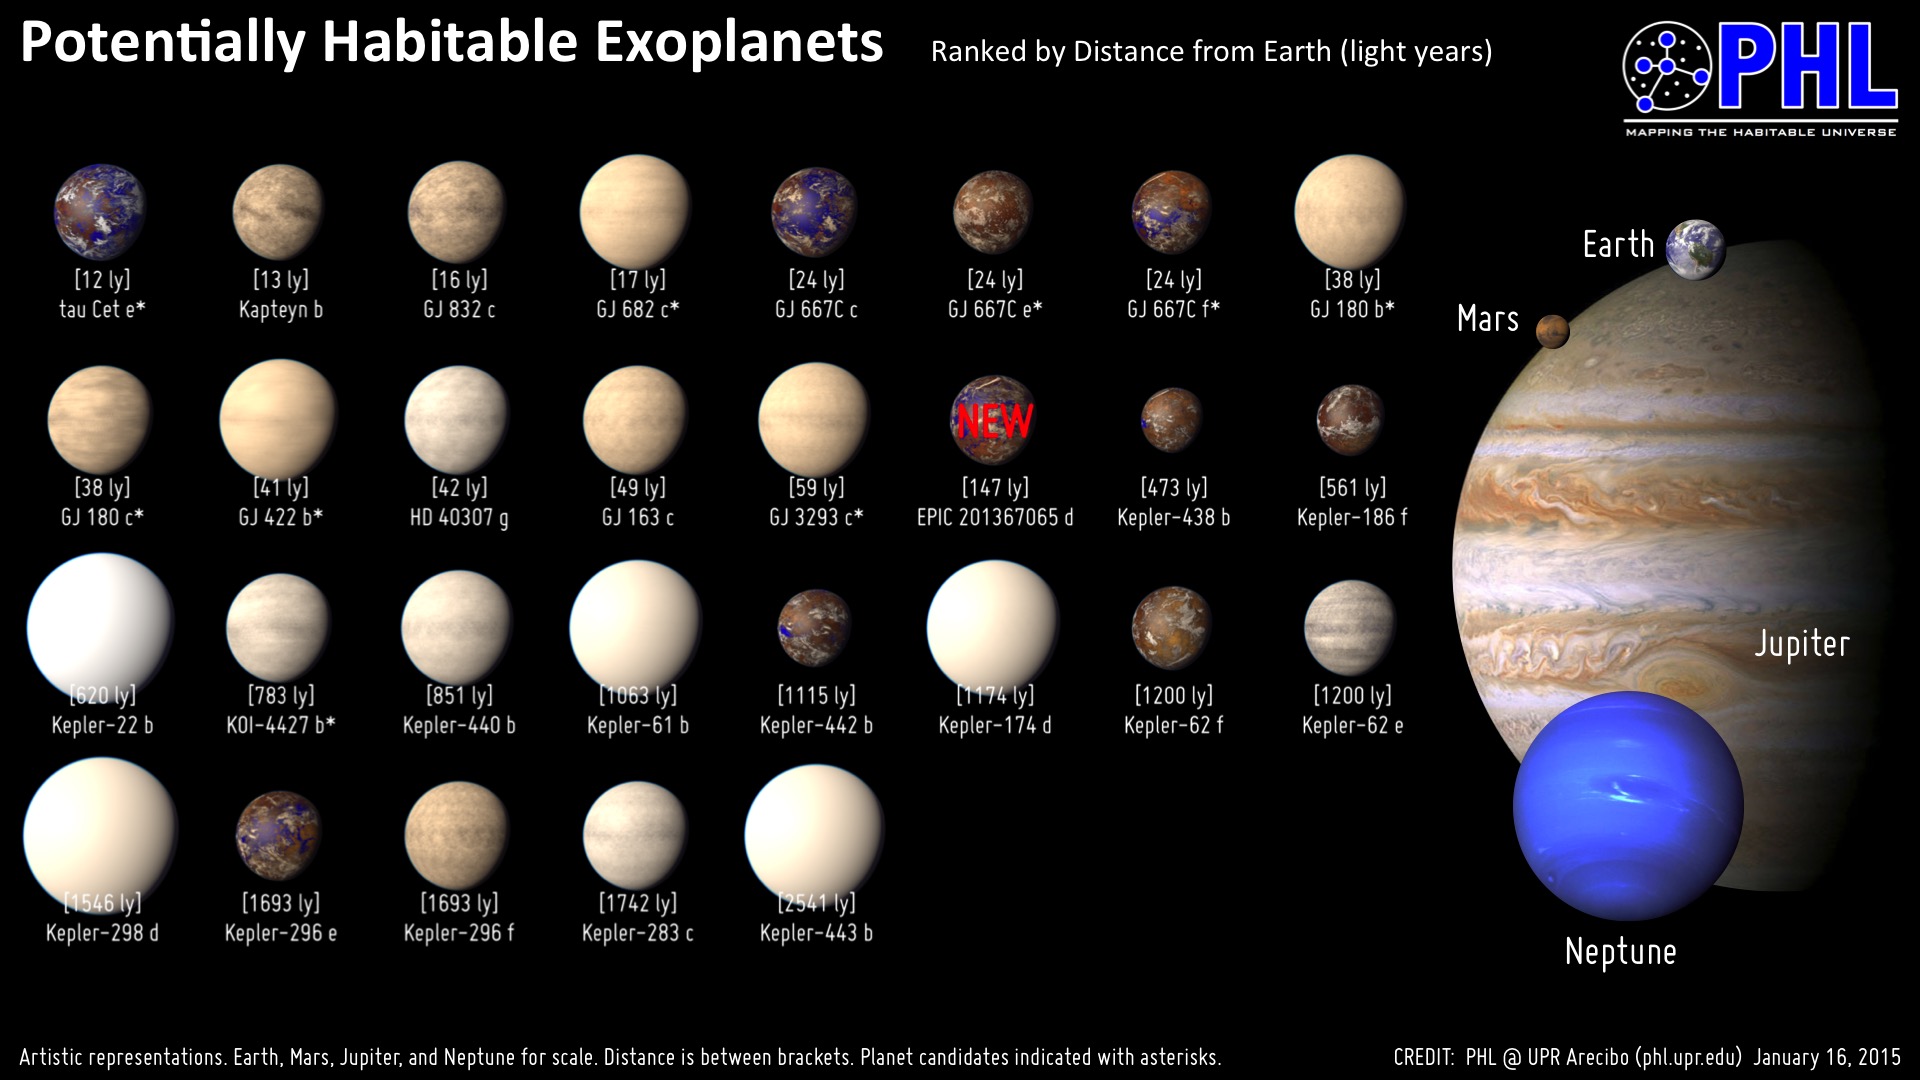
Image from (CC)
Planetary Habitability Laboratory @ UPR Arecibo, 2015 found at http://phl.upr.edu/projects/habitable-exoplanets-catalog
So, what about life?
In 1961, Frank Drake presented what he called the "Drake Equation",
an equation designed to calculate the what he believed would be the
number of occurrences of intelligent life within the universe.
The equation is

where:
N = the
number of civilizations in our galaxy
with which radio-communication might be possible
and
R* =
the average rate of
star formation in our galaxy
fp = the fraction of those
stars that have planets
ne = the average number
of planets that can potentially support life per star that has planets
fl = the fraction of
planets that could support life that actually develop life at some
point
fi = the fraction of
planets with life that actually go on to develop intelligent life (civilizations)
fc = the fraction of
civilizations that develop a technology that releases detectable
signs of their existence into space
L = the length
of time for which such civilizations release detectable signals
into space
So, what is the result of this equation? The answer is that
there's no good result. Many of the variables in this equation
have to be estimated, so the equation gives us a fleeting glimpse
at best. As the equation is filled in, the variables become harder
to estimate. In particular, we have no idea how to estimate L, the length of time
intelligent life may be able to broadcast. This is because we only
have one example to compare to- ourselves. In 2010, the Italian
astronomer Claudio
Maccone modified the drake equation to be represented as a
log-normal distribution and developed the following graph

A bell curve demonstrating probability of finding nearby
civilizations
This graph was created by Claudio Maccone in 2010
A link of his lecture can be found at
http://www.seti.org/seti-institute/weeky-lecture/statistical-drake-equation
With his equation, Maccone noted that there may be as many as 4,600
other civilizations in our galaxy alone.
He also noted that this is still a very rough guess, and that the
number itself is not important.
The graph shows that the probability is almost zero at anything
less than 500 light years. Humans started transmitting radio waves
into space in the 1900's, so we haven't even transmitted 100 light
years out yet.
Asteroid Impact
Another function of probability in physics is determining
probability of asteroid impacts
NASA and other space monitoring agencies use something called the
Torino Scale to measure the hazard of near Earth objects. The
Torino Scale takes in account the probability of impact and the
kinetic energy of the object to output an arbitrary danger scale.

The Torino Scale as from http://impact.arc.nasa.gov/torino.cfm
Image retrieved from http://en.wikipedia.org/wiki/Torino_scale
The NASA near Earth Object Program tracks hundreds of detectable
asteroids, and has a database of asteroids that may impact Earth
within the next 100 years. Currently, there are no objects with a
Torino rating greater than 0.
The largest asteroid being observed is designated 29075 1950 DA.
It is 1.3 km in diameter, and has been monitored since 1950. It is
still a very low risk, as it only has a 1 in 20,000 chance of
hitting sometime in the year 2800-2900.
Probability is an interesting concept. In reality, it is a way for
us to represent something as absolute when we only have limited
information on it. As we go towards the future, increasing sample
size means that we will obtain increasingly accurate data that
better allows us to understand our universe.
Bibliography
[1] Devore, J (2012) Probability and Statistics.San
Luis Obispo, CA: Brooks/Cole Cengage Learning
[2] 100 Billion Alien Planets Fill Our Milky
Way Galaxy. (2013) Space.com retrieved from
http://www.space.com/19103-milky-way-100-billion-planets.html
[3] Lewis, T (2013) Earth Like Planets
Suprisingly Common In Huffington Post retrieved from
http://www.huffingtonpost.com/2013/11/04/earth-like-habitable-planets-kepler-space-video_n_4214758.html
[4] The Drake Equation Frank Drake (1961) retrieved
from http://www.seti.org/drakeequation
[5] Habitable Exoplanet Catalog (2015) From The
Planetary Habital Labratory retrieved from
http://phl.upr.edu/projects/habitable-exoplanets-catalog
[6] Haynes, W.M. (1996) CRC Handbook of
Chemistry and Physics, 77th Edition
[7] Earth Impact database (2011) From The Planetary and Space Science Centre, University of New Brunswick, Fredericton, New Brunswick, Canada
retrieved from
http://www.passc.net/EarthImpactDatabase/Diametersort.html
[8] Risk Education (2012) From The institute of
Materials, Minerals, and Mining retrieved from
http://www.risk-ed.org/pages/risk/asteroid_prob.htm
[9] Background courtesy of
http://abstract.desktopnexus.com/wallpaper/1306989/,
desktopnexus.com 2012
[10] Current Impact Risks (2015) NASA retrieved from
http://neo.jpl.nasa.gov/risks/
[11] How many alien civilizations are there? (2012)
Bruno Martini retrieved from
http://www.astrobio.net/news-exclusive/at-last-how-many-alien-civilizations-are-there/
[12] Normal Distribution (2012) Donna Roberts
retrieved from
http://www.regentsprep.org/regents/math/algtrig/ats2/normallesson.htm
[13] Understanding Binomial Confidence
intervals (2013) Philip Mayfield retrieved from
http://www.sigmazone.com/binomial_confidence_interval.htm