In the map below, altitude of the tropopause shows up as pressure height, so the higher values are for lower altitude geometrically. Superimposed winds show the proximity of the jet stream to steep gradients in tropopause height. Such gradients near the North Carolina coast reach to point where tropopausal folding might be expected.

http://www.met.tamu.edu/class/Metr151/tut/upair/maps5.html
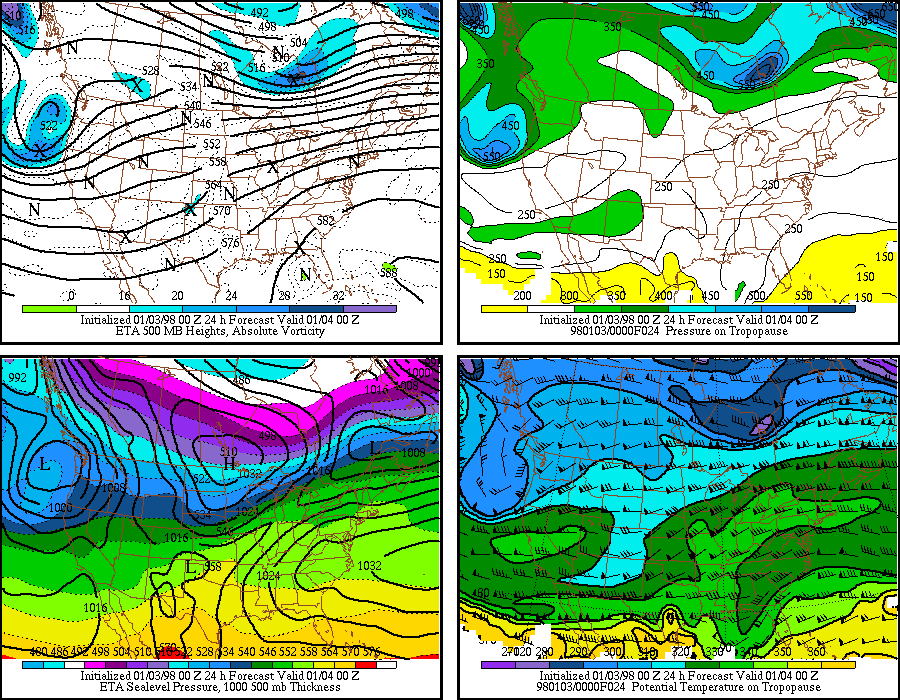
The maps below show further relationships between the tropopause level, potential temperatures, vorticity and sea level pressure.

http://www-das.uwyo.edu/~geerts/cwx/notes/chap01/tropeta_4.gif
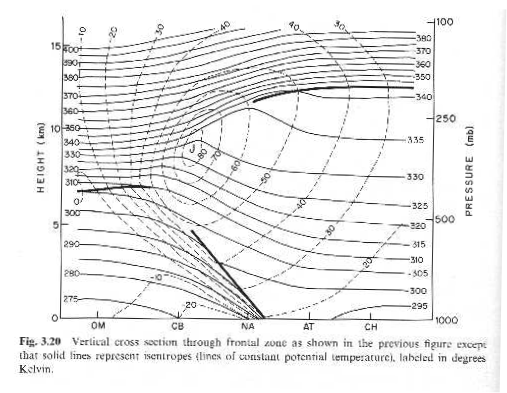
The area of low tropopause height in north Ontario seems to correspond to an area of polar air intrusion. The cross section below shows the spatial relationship between a cold front and a tropopause discontinuity.
Wallace
and Hobbs (1977)
No tropopause folding appears on this cross section, although the intrusion of cold air at the lower levels occurs at the familiar point where jet stream and tropopausal discontinuity coincide. Under what conditions might the tropical and polar tropopause levels overlap, and what would be the result?