Physics Theory
The sterling cycle uses 2 isothermal processes and two isovolumetric
processes. Because no work is done during isovolumetric processes the
work out is the work done in the isothermal process. The definition of
work done by a gas is:

using the ideal gas law to replace P the equation becomes:

Because n R and T are constants they can be pulled out of the integral
and the equation becomes:

The work done on the gas is simpily the negative of the work done by
it. Using properties of logarithms the equation becomes:

Work is done by the gas when it expands isothermally and work is done
by it when it is isothermally compressed, so the total work done is the
difference between the work done by the gas when it expands and the
work done on it when it contracts:

Heat is added by increasing the pressure isovolumetrically and
expanding isothermally. For an isovolumetric process:

For an isothermal process the heat transfered is equal to the work done
by the gas. So the heat added is:

The total heat added in one cycle is:

and similarly the heat rejected to the cold reservoir in the rest of
the cycle is:

the efficiency of any process is the useful stuff over the energy
input. In this case that is the work out over the heat in:

The Carnot engine is a theoretical heat engine that is the most
efficent a heat engine that operates on the same temperature difference
can be. The Carnot efficiency as given by Serway in chapter 22.4 is:

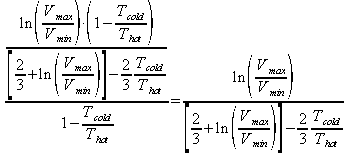
The percentage of the Carnot efficiency that a sterling engine gets is
then defined by:

The compression ratio for any engine is simply defined as the minimum
volume over the maximum volume. a better discription of compression
ratio is provided by Wikipedia

Only the javascript code that runs the PV diagram will be described here. To see the full source right click on a blank part of the P-V page and select view page source. The diagram is drawn in a canvas element. Unfortunately canvas elements can not draw text due to variations in text size so the scale can not be shown.
		// get the canvas element using the DOM
		var canvas = document.getElementById('diagram');
		// Make sure we don't execute when canvas isn't supported
		var ctx=null;
		if (canvas.getContext){
			ctx = canvas.getContext('2d');
			ctx.clearRect(0,0,canvas.width,canvas.height);
			// use getContext to use the canvas for drawing
		}
The canvas element is used to draw the PV diagram. So the first thing that has to be done is to get the element, figure out if the canvas element is supported and clear the canvas. If the canvas element is not supported the only thing that should be skipped is drawing to the canvas.
		window.status="";
		var outputErr=document.getElementById("error");
		outputErr.value="";
		var v1=Number(document.getElementById("v1").value);
		if(v1<=0){
			outputErr.value=window.status="Minimum volume must be greater than zero";
			return;
		}
		var v2=Number(document.getElementById("v2").value);
		if(v2<=v1){
			outputErr.value=window.status="Maximum volume must be larger then minimum volume";
			return;
		}
		var tc=Number(document.getElementById("tc").value);
		if(tc<0){
			outputErr.value=window.status="Cold temp must be greater then zero";
			return;
		}
		var th=Number(document.getElementById("th").value);
		if(th<=tc){
			outputErr.value=window.status="hot temp must be greater then cold temp";
			return;
		}
		var n=Number(document.getElementById("n").value);
		if(n<=0){
			outputErr.value=window.status="the amount of working fluid must be greater then zero";
			return;
		}
Next the error outputs (a text output and the status line) are cleared and values are parsed from the input text boxes if an illegal value is found then an error is shown and the function returns
		document.getElementById("w-out").value=""+(n*R*Math.log(v2/v1)*(th-tc)).toPrecision(3)+" J";
		document.getElementById("q-hot").value=""+(n*R*(th*(2/3+Math.log(v2/v1))-2/3*tc)).toPrecision(3)+" J";
		document.getElementById("q-cold").value=""+(n*R*(2/3*th+tc*(Math.log(v2/v1)-2/3))).toPrecision(3)+" J";
		document.getElementById("eff").value=""+(100*Math.log(v2/v1)*(1-tc/th)/((2/3+Math.log(v2/v1))-2*tc/(3*th))).toPrecision(3)+"%";
		document.getElementById("c-eff").value=""+(100*(1-tc/th)).toPrecision(3)+"%";
		document.getElementById("pc-eff").value=""+(100*Math.log(v2/v1)/((2/3+Math.log(v2/v1))-2*tc/(3*th))).toPrecision(3)+"%";
		document.getElementById("cr").value=""+(v2/v1);
next the output text boxes are set according to the equations developed in the physics theory above. toPrecision is a function that forces the number to have the specified number of significant figures.
		if(canvas.getContext){
			var vScale=(canvas.width-10)/v2,pScale=(canvas.height-10)/((n*R*th)/v1);
			ctx.clearRect(0,0,canvas.width,canvas.height);
			//draw the center
			ctx.beginPath();
			ctx.moveTo(v1*vScale,canvas.height-pScale*(n*R*tc)/v1);
			ctx.lineTo(v1*vScale,10);
			isotherm(th,v1,v2,n,pScale,vScale,ctx,canvas.height);
			ctx.lineTo(canvas.width-10,canvas.height-pScale*(n*R*tc)/v2);
			isotherm(tc,v2,v1,n,pScale,vScale,ctx,canvas.height);
			ctx.fillStyle = "orange";
			ctx.fill();
			//now draw the lines
			ctx.lineWidth = 4;
			ctx.lineCap = "round";
			ctx.lineJoin = "round";
			ctx.beginPath();
			ctx.moveTo(v1*vScale,canvas.height-pScale*(n*R*tc)/v1);
			ctx.lineTo(v1*vScale,10);
			isotherm(th,v1,v2,n,pScale,vScale,ctx,canvas.height);
			ctx.strokeStyle = "red";
			ctx.stroke();
			ctx.beginPath();
			ctx.strokeStyle = "blue";
			ctx.moveTo(canvas.width-10,canvas.height-pScale*(n*R*th)/v2);
			ctx.lineTo(canvas.width-10,canvas.height-pScale*(n*R*tc)/v2);
			isotherm(tc,v2,v1,n,pScale,vScale,ctx,canvas.height);
			ctx.stroke();
		}else if(!errorShown){
			alert('Your browser does not seem to suport the canvas element. Try using Firefox 1.5 or greater or Safari');
			errorShown=true;
		}
finally the PV diagram is drawn to the canvas. The diagram is auto scaled so that maximum pressure point is 10 pixel's from the top and the maximum volume point is 10 pixel's from
the right. If the canvas element is not supported then an error is shown when the page is first loaded and not shown again so that the text outputs can still be used. The processes
that add heat are shown in red and the processes that reject heat are shown in blue.
		function isotherm(t,vi,vf,n,pScale,vScale,ctx,h){
			const num=1000;
			for(var i=0,v=vi;i<=num;i++,v+=(vf-vi)/num){
				ctx.lineTo(v*vScale,h-pScale*(n*R*t)/v);
			}
		}
This function is used to draw isotherms on the P-V diagram. Originally an attempt was made to use Bézier curves but that failed so this function was created which uses lots of little lines to approximate a curve.


